

Scrutiny: Docker
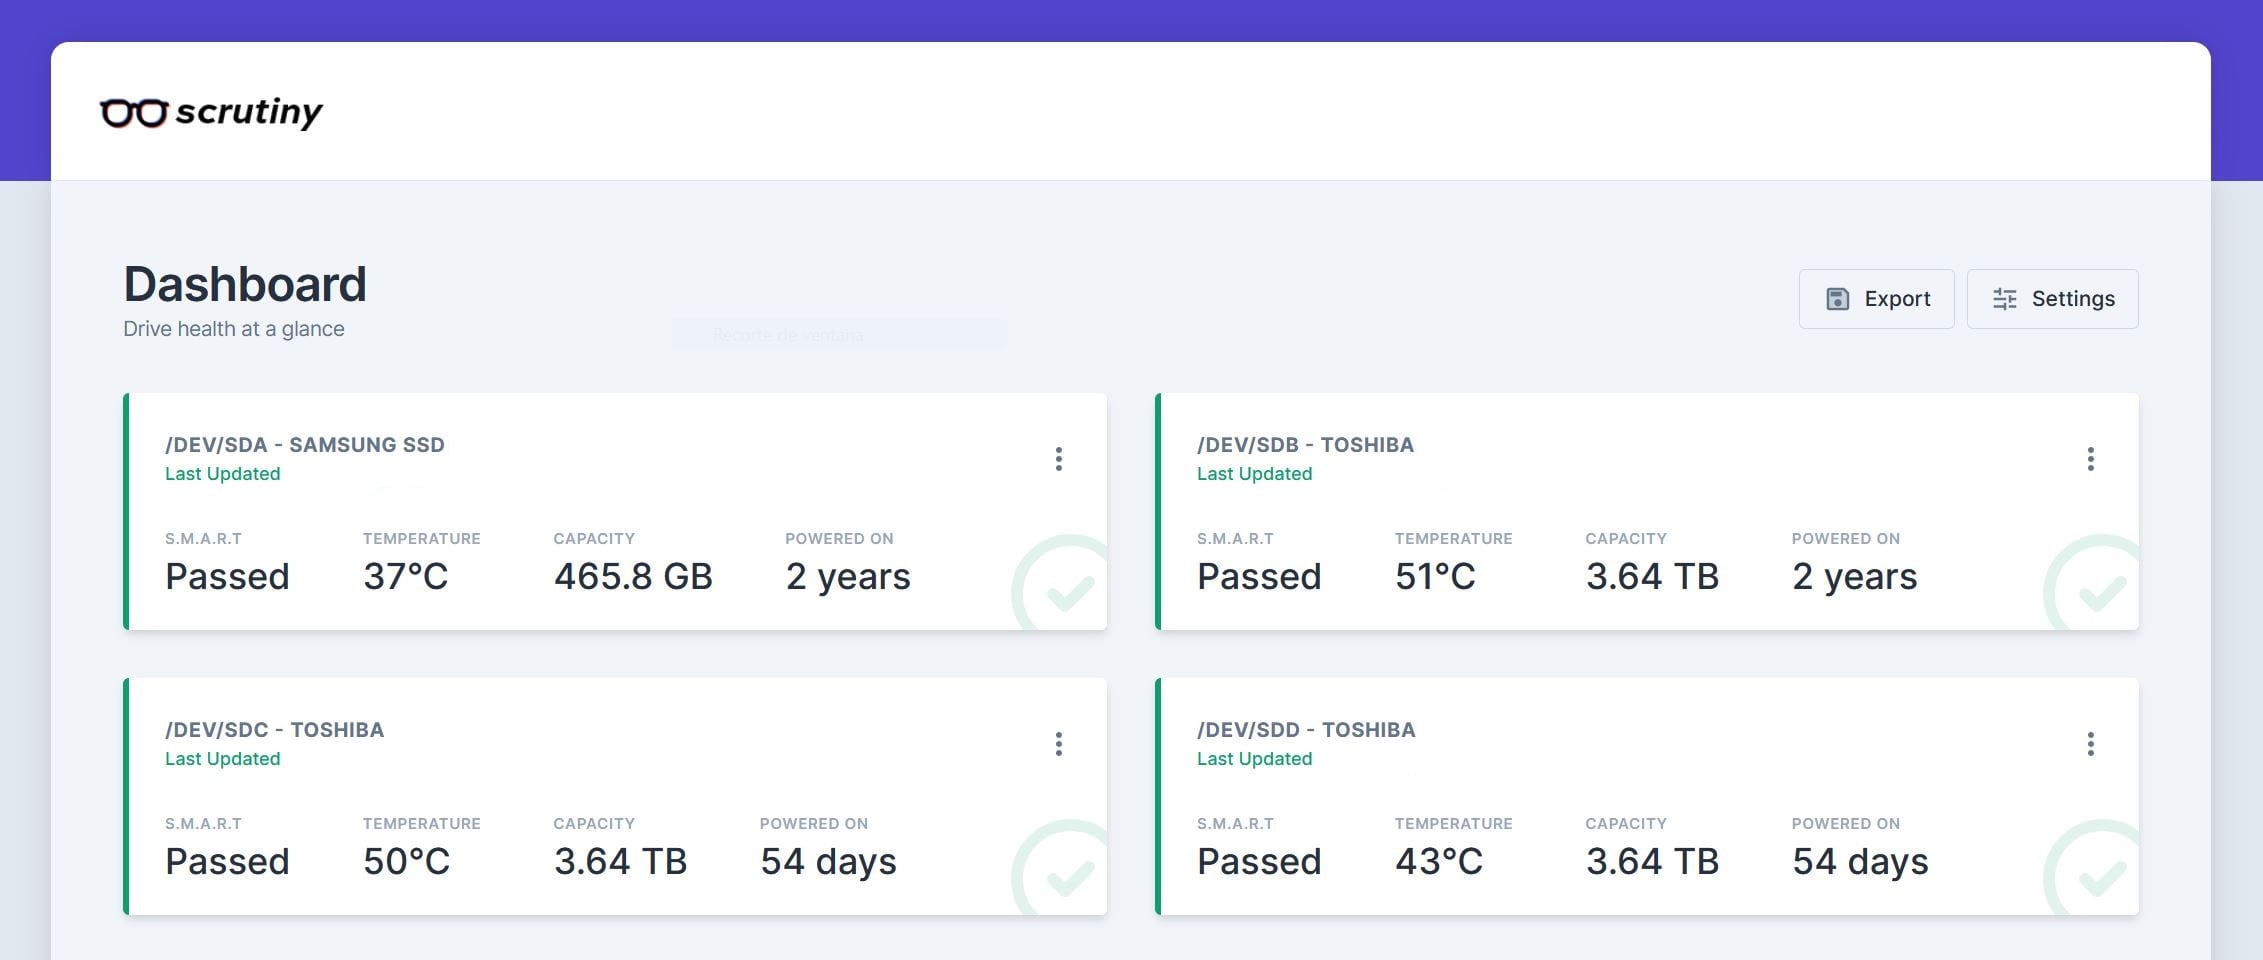
Scrutiny es un WebUI para monitorear estado S.M.A.R.T. de nuestros medios de almacenamiento.
Hasta ahora para el monitoreado del servidor usaba el demonio smartd, pero no disponía de metricas online.
Scrutiny es una aplicación simple pero de uso enfocado especialmente en los servidores, desarrollada en Go.
Entre otras, cuenta con las siguientes características principales:
- Panel de interfaz de usuario web: centrado en métricas críticas
- Integración smartd (sin reinventar la rueda)
- Detección automática de todos los discos duros conectados
- Seguimiento de métricas S.M.A.R.T para tendencias históricas
- Umbrales personalizados utilizando tasas de falla reales
- Seguimiento de temperatura
- Alertas / notificaciones configurables en el futuro a través de webhooks
- Prueba y seguimiento del rendimiento del disco duro (en desarrollo)
Vamos a realizar unos pasos previos para preparar el entorno. En primer lugar creamos las carpetas donde alojar el proyecto:
mkdir -p $HOME/docker/scrutiny/config && \
cd $HOME/docker/scrutiny
Ejecutamos en la terminal la siguiente orden para identificar los HD’s que posteriormente anotaremos para editar el fichero docker-compose:
lsblk
Ahora vamos a crear el fichero de configuración docker-compose.yml lanzando el siguiente comando:
cat << EOF > $HOME/docker/scrutiny/docker-compose.yml
version: "2.1"
services:
  scrutiny:
    image: ghcr.io/analogj/scrutiny:master-omnibus
    container_name: Scrutiny
    cap_add:
      - SYS_RAWIO
      - SYS_ADMIN
    environment:
      - COLLECTOR_CRON_SCHEDULE=0 23 * * *
      - TZ=Europe/Madrid
    volumes:
     - "./config:/opt/scrutiny/config"
     - /run/udev:/run/udev:ro
    ports:
      - 8088:8080
    devices:
      - "/dev/nvme0"
      - "/dev/sda"
      - "/dev/sdb"
      - "/dev/sdc"
      - "/dev/sdd"
    restart: always
EOF
Vamos a repasar los principales parámetros a modificar para adaptarlos a nuestro sistema y configuración especifica:
| Parámetro | Función |
|---|---|
./config:/opt/scrutiny/config |
Ruta donde almacenaremos la configuración |
/run/udev:/run/udev:ro |
Ruta donde consultaremos los metadatos del sistema |
8088:8080 |
Puerto gestión web 8088 |
/dev/nvme0 |
Monitorizar el HD nvme0, ejecutamos lsblk para listar HD’s |
/dev/sda |
Monitorizar el HD sda, ejecutamos lsblk para listar HD’s |
/dev/sdb |
Monitorizar el HD sdb, ejecutamos lsblk para listar HD’s |
/dev/sdc |
Monitorizar el HD sdc, ejecutamos lsblk para listar HD’s |
/dev/sdd |
Monitorizar el HD sdd, ejecutamos lsblk para listar HD’s |
restart: always |
Habilitamos que tras reiniciar la maquina anfitrion vuelva a cargar el servicio |
Una vez configurado, lo levantamos para ser creado y ejecutado:
docker-compose up -d
A continuación entramos dentro del contenedor de imagen:
docker exec -it Scrutiny bash
Forzamos la ejecución del script que actualiza información sobre discos duros:
scrutiny-collector-metrics run
Ejemplo de ejecución en mi sistema:
pi@overclock:~/docker/scrutiny$ docker exec -it Scrutiny bash
root@2688892d1188:/# scrutiny-collector-metrics run
2021/02/18 20:07:14 No configuration file found at /scrutiny/config/collector.yaml. Using Defaults.

 ___   ___  ____  __  __  ____  ____  _  _  _  _
/ __) / __)(  _ \(  )(  )(_  _)(_  _)( \( )( \/ )
\__ \( (__  )   / )(__)(   )(   _)(_  )  (  \  /
(___/ \___)(_)\_)(______) (__) (____)(_)\_) (__)
AnalogJ/scrutiny/metrics                                dev-0.3.5

INFO[0000] Verifying required tools                      type=metrics
INFO[0000] Executing command: smartctl --scan -j         type=metrics
{
  "json_format_version": [
    1,
    0
  ],
  "smartctl": {
    "version": [
      7,
      1
    ],

	[...]

      }
    ],
    "reset": false
  }
}
INFO[0006] Publishing smartctl results for 0x5000039a3bc01274  type=metrics
INFO[0006] Main: Completed                               type=metrics
root@2688892d1188:/# exit
exit
pi@overclock:~/docker/scrutiny$
Tras ello, podremos consultar el servicio, que en mi caso estaría disponible en la dirección web http://192.168.1.90:8088
NOTA: Si queremos personalizar la notificación, editamos la configuración y reiniciamos el docker:
nano $HOME/docker/scrutiny/config/scrutiny.yaml && \
docker restart Scrutiny
Y pegamos el contenido del fichero de configuración:
# Commented Scrutiny Configuration File
#
# The default location for this file is /opt/scrutiny/config/scrutiny.yaml.
# In some cases to improve clarity default values are specified,
# uncommented. Other example values are commented out.
#
# When this file is parsed by Scrutiny, all configuration file keys are
# lowercased automatically. As such, Configuration keys are case-insensitive,
# and should be lowercase in this file to be consistent with usage.


######################################################################
# Version
#
# version specifies the version of this configuration file schema, not
# the scrutiny binary. There is only 1 version available at the moment
version: 1

web:
  listen:
    port: 8080
    host: 0.0.0.0

    # if you're using a reverse proxy like apache/nginx, you can override this value to serve scrutiny on a subpath.
    # eg. http://example.com/scrutiny/* vs http://example.com:8080
    # see docs/TROUBLESHOOTING_REVERSE_PROXY.md
    # basepath: `/scrutiny`
    # leave empty unless behind a path prefixed proxy
    basepath: ''
  database:
    # can also set absolute path here
    location: /opt/scrutiny/config/scrutiny.db
  src:
    # the location on the filesystem where scrutiny javascript + css is located
    frontend:
      path: /opt/scrutiny/web

  # if you're running influxdb on a different host (or using a cloud-provider) you'll need to update the host & port below.
  # token, org, bucket are unnecessary for a new InfluxDB installation, as Scrutiny will automatically run the InfluxDB setup,
  # and store the information in the config file. If you 're re-using an existing influxdb installation, you'll need to provide
  # the `token`
  influxdb:
#    scheme: 'http'
    host: 0.0.0.0
    port: 8086
#    token: 'my-token'
#    org: 'my-org'
#    bucket: 'bucket'
    retention_policy: true
    # if you wish to disable TLS certificate verification,
    # when using self-signed certificates for example,
    # then uncomment the lines below and set `insecure_skip_verify: true`
    # tls:
    #   insecure_skip_verify: false

log:
  file: '' #absolute or relative paths allowed, eg. web.log
  level: INFO


# Notification "urls" look like the following. For more information about service specific configuration see
# Shoutrrr's documentation: https://containrrr.dev/shoutrrr/services/overview/
#
# note, usernames and passwords containing special characters will need to be urlencoded.
# if your username is: "myname@example.com" and your password is "124@34$1"
# your shoutrrr url will look like: "smtp://myname%40example%2Ecom:124%4034%241@ms.my.domain.com:587"

notify:
  urls:
#    - "discord://token@webhookid"
#    - "telegram://token@telegram?channels=channel-1[,channel-2,...]"
#    - "pushover://shoutrrr:apiToken@userKey/?priority=1&devices=device1[,device2, ...]"
#    - "slack://[botname@]token-a/token-b/token-c"
#    - "smtp://username:password@host:port/?fromAddress=fromAddress&toAddresses=recipient1[,recipient2,...]"
#    - "teams://token-a/token-b/token-c"
#    - "gotify://gotify-host/token"
#    - "pushbullet://api-token[/device/#channel/email]"
#    - "ifttt://key/?events=event1[,event2,...]&value1=value1&value2=value2&value3=value3"
#    - "mattermost://[username@]mattermost-host/token[/channel]"
#    - "ntfy://username:password@host:port/topic"
#    - "hangouts://chat.googleapis.com/v1/spaces/FOO/messages?key=bar&token=baz"
#    - "zulip://bot-mail:bot-key@zulip-domain/?stream=name-or-id&topic=name"
#    - "join://shoutrrr:api-key@join/?devices=device1[,device2, ...][&icon=icon][&title=title]"
#    - "script:///file/path/on/disk"
#    - "https://www.example.com/path"

########################################################################################################################
# FEATURES COMING SOON
#
# The following commented out sections are a preview of additional configuration options that will be available soon.
#
########################################################################################################################

#limits:
#  ata:
#    critical:
#      error: 10
#    standard:
#      error: 20
#      warn: 10
#  scsi:
#    critical: true
#    standard: true
#  nvme:
#    critical: true
#    standard: true
Modificamos el servicio de notificación y guardamos el fichero Para poder probar que la notificación ha sido debidamente configurada. Podemos lanzar la siguente consulta:
curl -X POST http://localhost:8088/api/health/notify

Y listo!